If you post the same idea as a Reel and a Short, the two dashboards will not tell the same story. The useful 2026 comparison is not “which platform is winning.” It is which report answers the question you have today.
Quick Take
- Use YouTube Studio to judge whether a Short stopped the swipe and held engaged viewers.
- Use Instagram Insights to judge reach, watch time, saves, shares, and follows from a Reel.
- Treat view totals as platform-specific. Replays and engaged-view rules differ.
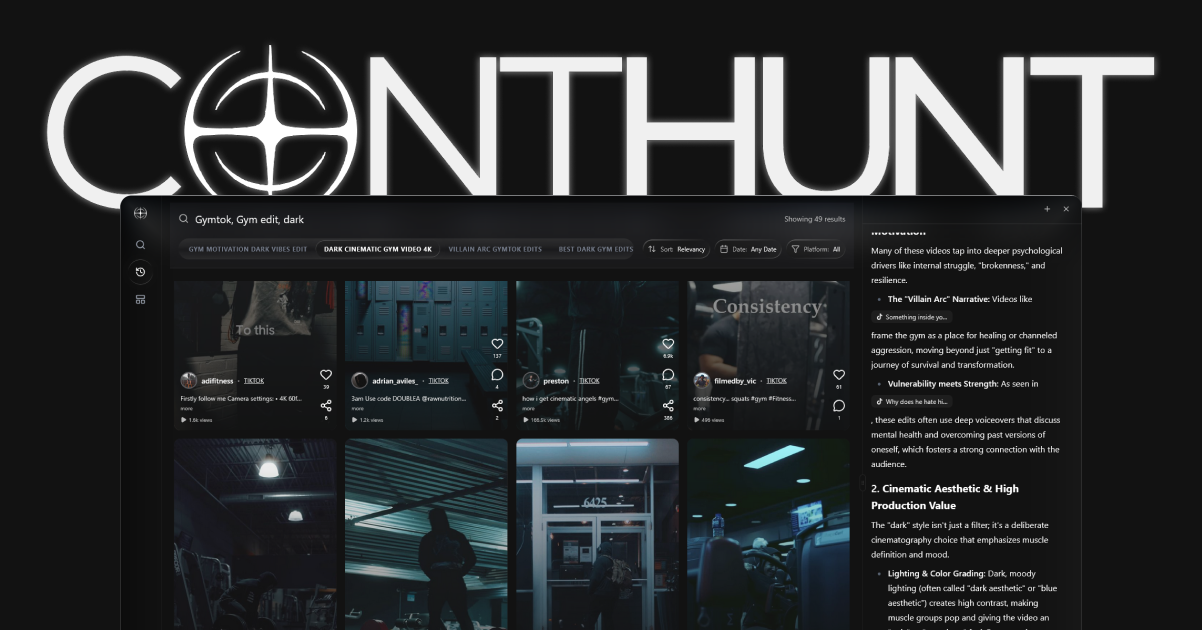
- Use ContHunt for public examples in the niche, not as a replacement for either native dashboard.
1. How Views Are Counted
This is the comparison that breaks most side-by-side spreadsheets.
YouTube counts a view when a video starts to play, including Shorts. Studio also reports engaged views: how many times viewers stayed past the first seconds, not including loops. Stayed to watch (also shown as how many chose to view on the Shorts Content tab) is the percentage of times viewers watched instead of swiping away. Average view duration and average percentage viewed are calculated from engaged views and their watch time.
Instagram counts a Reel view each time the Reel starts to play or replay. Watch time includes replay time. Average watch time is watch time divided by initial views (the first play in a Reel session). Accounts reached is unique accounts that saw the Reel on screen, whether or not it played. Instagram publishes these definitions in its Reels insights help page.
A generic example: a 20-second clip that loops twice can add more Instagram views than YouTube engaged views. That is a counting difference, not proof that one platform “liked” the video more.
For the full Shorts metric list, see YouTube Shorts Analytics. For the Reels list, see Instagram Reels Analytics.
2. YouTube Studio: Feed Diagnostics
YouTube Studio is built around how a Short is shown and whether people stay.
Check first:
- How many chose to view / stayed to watch. If this is weak versus your other Shorts of similar length, the opening frame, title, or audience fit is the problem.
- Engaged views vs. views. A large gap means a lot of starts are not becoming real watches.
- Average percentage viewed and the retention graph. These tell you whether the middle or the payoff is failing.
- How viewers found the Short. Feed, search, channel, browse, and external traffic need different packaging.
YouTube does not publish a public “viral probability” score. Use your own Shorts as the benchmark.
ContHunt Tip: When a Short earns impressions but weak chose-to-view, compare the first frame and title against public outliers in the same niche before you change posting time.
3. Instagram Insights: Reach and Community Actions
Instagram is faster to read on a phone. Open the Reel, tap View insights. Professional accounts also get the Professional Dashboard for account-level totals.
Check first:
- Views vs. accounts reached. Views include replays; reach is unique accounts.
- Average watch time vs. the Reel’s length. This is your pacing check.
- Saves, shares, comments, and follows. These are the community actions Instagram surfaces on the Reel.
- Follower vs. non-follower views when the app shows the split. That is how you tell a fan hit from a discovery hit.
Instagram does not publish an “interest node map” or a guaranteed save-to-reach ranking formula. If a Reel is useful, saves usually show it. If it is pass-along, shares usually show it.
4. What Each Dashboard Is Better For
| Question | Better native report | Why |
|---|---|---|
| Did the opening stop the swipe? | YouTube Studio | Chose-to-view / stayed to watch is a feed diagnostic. |
| Did people stay after the first seconds? | YouTube Studio | Engaged views and APV are defined for this. |
| Did non-followers see it? | Instagram Insights | Reach and follower split are easier to scan on a Reel. |
| Was it worth saving or sending? | Instagram Insights | Saves, shares, and follows sit on the same insight sheet. |
| Did search or the feed find it? | YouTube Studio | Shorts traffic-source reports are more explicit. |
| Can I check this in 30 seconds on my phone? | Instagram Insights | View insights is on the post. |
This table is a workflow guide, not a ranking of the two apps.
5. Revenue and Monetization Reports
Keep revenue in a separate conversation from discovery metrics.
- YouTube: Shorts revenue and Partner Program eligibility use engaged views, not the public start-to-play view count. Studio’s revenue reports are the source of truth for your own channel.
- Instagram: Bonuses, trials, and shop results (when available on your account) live in professional tools, not in the same Reel insight card as watch time.
Do not treat a CPM or bonus figure from one app as a forecast for the other.
6. A Practical Review Loop
- Pick one idea you posted on both apps, or two near-identical ideas.
- On YouTube, write down chose-to-view, engaged views, and average percentage viewed.
- On Instagram, write down views, accounts reached, average watch time, saves, and shares.
- Ask one question only: did the hook fail, did the middle fail, or did the payoff fail?
- Change one thing on the next upload.
Use YouTube Shorts Best Practices 2026 if the hook or cover is the issue. Use Instagram Reels Content Ideas if you need a format to test next.
Checklist
- [ ] I am not comparing raw Reels views to raw Shorts views
- [ ] I checked chose-to-view on the Short
- [ ] I checked reach, watch time, saves, and shares on the Reel
- [ ] I compared each post to my own similar posts first
- [ ] I used ContHunt only for public examples, not invented benchmarks
Conclusion
In 2026, YouTube Studio is the better retention and swipe lab. Instagram Insights is the better reach and interaction sheet. Neither dashboard needs a fictional score to be useful. Review the metrics each company actually publishes, keep the two view definitions separate, and use ContHunt to see which public Reels and Shorts in your niche already earned attention.
Related Reading
- YouTube Shorts Analytics
- Instagram Reels Analytics
- YouTube Shorts Best Practices 2026
- Instagram Reels Content Ideas
- How to Check TikTok Analytics
Key data
- YouTube Diagnostic
- Chose to view — Studio's Shorts report for viewed versus swiped away in the feed.
- Instagram Diagnostic
- View insights — Open a Reel to see views, watch time, reach, and interactions.
- Cross-App Rule
- Don't mix view totals — Replay rules and engaged-view definitions are not interchangeable.
Sources
- Understand your YouTube content performance · YouTube Help
- Content tab analytics tips · YouTube Help
- View insights on your Instagram reels · Instagram Help Center