TikTok Analytics Dashboard: Mastering Your Metrics in 2026
Short Answer
In 2026, the key to the TikTok Analytics Dashboard is the **'Retention-to-Share Velocity'** ratio. While views are a vanity metric, your 'Retention Curve' (visible in the Video Details tab) tells you exactly when users are dropping off. Aim for a 50% retention rate at the 3-second mark and a 5% 'Share Rate' to signal the algorithm that your content is high-utility and viral-ready.
TikTok Analytics Dashboard: Mastering Your Metrics in 2026
The TikTok Analytics Dashboard is your most powerful tool for growth, but in 2026, most creators are still looking at the wrong numbers. If you’re only tracking “Likes,” you’re ignoring the data that actually dictates your viral potential.
Here is how to read your 2026 TikTok dashboard like a pro.
1. The Key Metric: The Retention Curve
Inside the Video Details tab, your retention curve is a 2026 truth-bomb.
- The Hook Drop: If your curve drops sharply in the first 2 seconds, your hook is weak.
- The Middle Slump: If users leave in the middle, your pacing is too slow.
- The Completion Spike: High ‘Watched Full Video’ percentages (aim for 30%+) are the primary signal for extended algorithmic push.
2. Audience Insights & “Node Alignment”
TikTok’s 2026 “Audience Interests” section is a goldmine for competitive strategy.
- Beyond Demographics: Age and Location are secondary. Look at the “Topics” your audience engages with. If you are a Fitness creator and your audience is also watching “Productivity Hacks,” you should create a “Fitness for Productive People” series.
- Active Times: Don’t just post when your audience is awake; post 30 minutes before their peak activity window to catch the rising engagement velocity.
3. Real-Time vs. Historical Data
In 2026, you need a two-speed data strategy.
- Tactical (Real-Time): Monitor the first hour of performance. If a video is outperforming your average ‘Share Velocity’ by 2x, double down on engagement in the comments.
- Strategic (Historical): Look at your “7-Day Content Performance” to identify which specific Interest Nodes are yielding the highest growth over time.
4. Enhancing Your Data with ContHunt
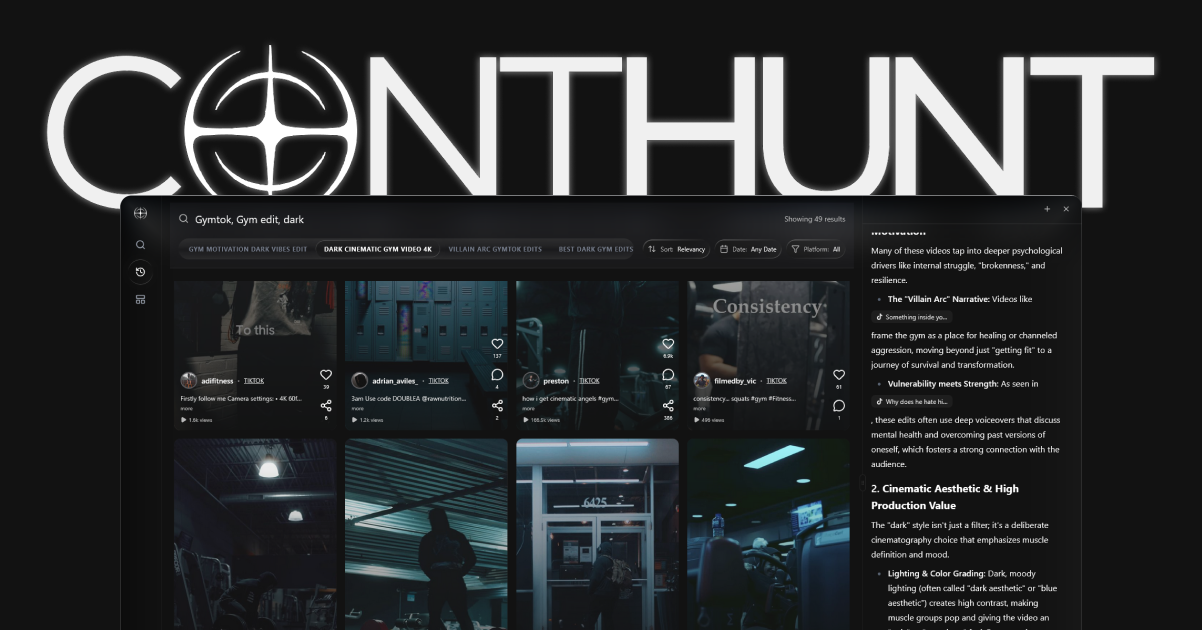
The native TikTok dashboard tells you about yourself. ContHunt tells you about the market.
- Competitive Benchmarking: Pair your dashboard data with ContHunt to see how your retention curves compare to the leaders in your niche. Are you losing people faster than the average? ContHunt will tell you.
- Viral Velocity Triggers: ContHunt provides alerts when a competitor’s post hits a ‘Velocity Spike,’ allowing you to analyze their strategy in real-time.
2026 TikTok Audit Checklist
- [ ] Checked the 2-second retention hook on my last 5 videos?
- [ ] Identified the top 3 ‘Audience Interest’ nodes in my dashboard?
- [ ] Verified if ‘Watch Full Video’ percentage is above 25%?
- [ ] Cross-referenced real-time view counts against ContHunt benchmarks?
Conclusion
Mastering the TikTok Analytics Dashboard in 2026 is about moving from “What happened?” to “Why did it happen?”. By focusing on retention curves and interest-node alignment, and augmenting that data with the competitive power of ContHunt, you can build a predictable, scalable growth engine on the world’s most dynamic social platform. Record your data, respect the curve, and reach your audience.
Key Data Points
Retention Benchmark
60%
The target retention rate after the first 2 seconds for a video to be considered 'Highly Engaging' by the 2026 TikTok algorithm.
Viral Probability
85%
The likelihood of a video hitting the 'Global Feed' if share velocity exceeds 500 shares per 1,000 views in the first hour.